Now that you've got the basic chart patterns down, it's time to move on and add some more advanced tools to your trading arsenal.
In this lesson, we'll be looking at harmonic price patterns. These bad boys may be a little harder to grasp but once you spot these setups, it can lead to some very nice profits!
The whole idea of these patterns is that they help people spot possible retracements of recent trends. In fact, we'll make use of other tools we've already covered - the Fibonacci retracement and extensions!
Combining these wonderful tools to spot these harmonic patterns, we'll be able to distinguish possible areas for a continuation of the overall trend.
In this lesson, we're going to discuss the following Harmonic Price Patterns:
- ABCD Pattern
- Three-Drive Pattern
- Gartley Pattern
- Crab Pattern
- Bat Pattern
- Butterfly Pattern
Phew! That's quite a lot to cover!
But don't you worry... Once you get the hang of things, it'll be as easy as 1-2-3! We'll start off with the more basic ABCD and three-drive patterns before moving on to Gartley and the animals.
After learning about them, we'll take a look at the tools you need in order to trade these patterns successfully.
For all these harmonic patterns, the point is to wait for the entire pattern to complete before taking any short or long trades. You'll see what we're talking about later on so let's get started!
The ABCD and the Three-Drive
The ABCD
Let's start this lesson with the simplest harmonic pattern, and what could be more basic than your good ole ABC's? We'll just pop in another letter right there (because we're cool like that) and we've got the ABCD chart pattern!To spot this chart pattern, all you need are ultra-sharp hawk eyes and the handy-dandy Fibonacci tool.
For both the bullish and bearish versions of the ABCD chart pattern, the lines AB and CD are known as the legs while BC is called the correction or retracement. If you use the Fibonacci retracement tool on leg AB, the retracement BC should reach until the 0.618 level. Then, the line CD should be the 1.272 Fibonacci extension of BC.
Simple, right? All you have to do is wait for the entire pattern to complete (reach point D) before taking any short or long positions.


Oh, but if you want to be extra strict about it, here are a couple more rules for a valid ABCD pattern:
- The length of line AB should be equal to the length of line CD.
- The time it takes for the price to go from A to B should be equal to the time it takes for the price to move from C to D.
Three-Drive
The three-drive pattern is a lot like the ABCD pattern except that it has three legs (now known as drives) and two corrections or retracements. Easy as pie! In fact, this three-drive pattern is the ancestor of the Elliott Wave pattern.As usual, you'll need your hawk eyes, the Fibonacci tool, and a smidge of patience on this one.


As you can see from the charts above, point A should be the 61.8% retracement of drive 1. Similarly, point B should be the 0.618 retracement of drive 2. Then, drive 2 should be the 1.272 extension of correction A and drive 3 should be the 1.272 extension of correction B.
By the time the whole three-drive pattern is complete, that's when you can pull the trigger on your long or short trade. Typically, when the price reaches point B, you can already set your short or long orders at the 1.272 extension so that you won't miss out!
But first, it'd be better to check if these rules also hold true:
- The time it takes the price to complete drive 2 should be equal to the time it takes to complete drive 3.
- Also, the time to complete retracements A and B should be equal.
The Gartley and the Animals
Once upon a time, there was this insanely smart trader dude named Harold McKinley Gartley.He had a stock market advisory service in the mid-1930s with a huge following. This service was one of the first to apply scientific and statistical methods to analyze the stock market behavior.
According to Gartley, he was finally able to solve two of the biggest problems of traders: what and when to buy.
Soon enough, traders realized that these patterns could also be applied to other markets. Since then, various books, trading software, and other patterns (discussed below) have been made based on the Gartleys.
Gartley a.k.a. "222" Pattern
The Gartley "222" pattern is named for the page number it is found on in H.M. Gartleys book, Profits in the Stock Market. Gartleys are patterns that include the basic ABCD pattern we've already talked about, but are preceded by a significant high or low.Now, these patterns normally form when a correction of the overall trend is taking place and look like 'M' (or 'W' for bearish patterns). These patterns are used to help traders find good entry points to jump in on the overall trend.


A Gartley forms when the price action has been going on a recent uptrend (or downtrend) but has started to show signs of a correction.
What makes the Gartley such a nice setup when it forms is the reversal points are a Fibonacci retracement and Fibonacci extension level. This gives a stronger indication that the pair may actually reverse.
This pattern can be hard to spot and once you do, it can get confusing when you pop up all those Fibonacci tools. The key to avoiding all the confusion is to take things one step at a time.
In any case, the pattern contains a bullish or bearish ABCD pattern, but is preceded by a point (X) that is beyond point D. The "perfect" Gartley pattern has the following characteristics:
- Move AB should be the .618 retracement of move XA.
- Move BC should be either .382 or .886 retracement of move AB.
- If the retracement of move BC is .382 of move AB, then CD should be 1.272 of move BC. Consquently, if move BC is .886 of move AB, then CD should extend 1.618 of move BC.
- Move CD should be .786 retracement of move XA
The Animals
As time went by, the popularity of the Gartley pattern grew and people eventually came up with their own variations.For some odd reason, the discoverers of these variations decided to name them after animals (Maybe they were part of PETA?).Without further ado, here comes the animal pack...
The Crab
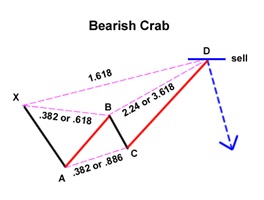

In 2000, Scott Carney, a firm believer in harmonic price patterns, discovered the "Crab".
According to him, this is the most accurate among all the harmonic patterns because of how extreme the Potential Reversal Zone (sometimes called "price better reverse or imma gonna lose my shirt" point) from move XA.
This pattern has a high reward-to-risk ratio because you can put a very tight stop loss. The "perfect" crab pattern must have the following aspects:
- Move AB should be the .382 or .618 retracement of move XA.
- Move BC can be either .382 or .886 retracement of move AB.
- If the retracement of move BC is .382 of move AB, then CD should be 2.24 of move BC. Consquently, if move BC is .886 of move AB, then CD should be 3.618 extension of move BC.
- CD should be 1.618 extension of move XA.
The Bat


Come 2001, Scott Carney founded another Harmonic Price Pattern called the "Bat." The Bat is defined by the .886 retracement of move XA as Potential Reversal Zone. The Bat pattern has the following qualities:
- Move AB should be the .382 or .500 retracement of move XA.
- Move BC can be either .382 or .886 retracement of move AB.
- If the retracement of move BC is .382 of move AB, then CD should be 1.618 extension of move BC. Consquently, if move BC is .886 of move AB, then CD should be 2.618 extension of move BC.
- CD should be .886 retracement of move XA.
The Butterfly


Then, there is the Butterfly pattern. Like Muhammad Ali, if you spot this setup, you'll surely be swinging for some knockout-sized pips!
Created by Bryce Gilmore, the perfect Butterfly pattern is defined by the .786 retracement of move AB with respect to move XA. The Butterfly contains these specific characteristics:
- Move AB should be the .786 retracement of move XA.
- Move BC can be either .382 or .886 retracement of move AB.
- If the retracement of move BC is .382 of move AB, then CD should be 1.618 extension of move BC. Consquently, if move BC is .886 of move AB, then CD should extend 2.618 of move BC.
- CD should be 1.27 or 1.618 extension of move XA.
3 Steps in Trading Harmonic Price Patterns
As you may have guessed, profiting off Harmonic Price Patterns is all about being able to spot those "perfect" patterns and buying or selling on their completion.There are three basic steps in spotting Harmonic Price Patterns:
- Step 1: Locate a potential Harmonic Price Pattern
- Step 2: Measure the potential Harmonic Price Pattern
- Step 3: Buy or sell on the completion of the Harmonic Price Pattern
By following these three basic steps, you can find high probability setups that will help you grab those oh-so-lovely pips.
Let's see this process in action!Step 1: Locate a potential Harmonic Price Pattern
Oh wow, that looks like a potential Harmonic Price Pattern! At this point in time, we're not exactly sure what kind of pattern that is. It LOOKS like a three-drive, but it could be a Bat or a Crab...
Heck, it could even be a Moose! In any case, let's label those reversal points.
Step 2: Measure the potential Harmonic Price Pattern
Using the Fibonacci tool, a pen, and a piece of paper, let us list down our observations.

- Move BC is .618 retracement of move AB.
- Move CD is 1.272 extension of move BC.
- The length of AB is roughly equal to the length of CD.
Step 3: Buy or sell on the completion of the Harmonic Price Pattern

Once the pattern is complete, all you have to do is respond appropriately with a buy or sell order.
In this case, you should buy at point D, which is the 1.272 Fibonacci extension of move CB, and put your stop loss a couple of pips below your entry price.
Is it really that easy?
Not exactly.
The problem with harmonic price patterns is that they are so perfect that they are so difficult to spot, kind of like a diamond in the rough.
shame on you for ripping off the content from Babypips and not even give them credit.
ReplyDeleteHi,
ReplyDeleteWe would like to advertise the Forex Brands in our network on your blog/website.
Preferably setting you up on an affiliate deal.
Would this be possible?
Please get in touch.
Kind regards,
Andrew
http://www.Advertising365.com
http://afs.advertising365.com/afs/wsignup.form.php
Skype:kratke
In my opinion, there are much more reliable platforms for traders. For example, I recommend checking out instaforex review company. It's a great option if you're looking for a remote job as well.
ReplyDeleteHello everyone, Are you looking for a professional crypto trader, forex and binary manager who will help you trade and manager your account with good and massive amount of profit in return. you can contact TD Ameritrade for your investment plan, for he helped me earned 8,500usd with little investment funds. TD Ameritrade you're the best trader I can recommend for anyone who wants to invest and trade with a genuine trader, he also helps in recovery of loss funds..you can contact him on his Email: tdameritrade077@gmail.com
ReplyDeleteVia whatsapp: (+12166263236)
I advice you shouldn't hesitate. He's great.